The statistical office of the European Union, Eurostat said that in 2019, Romania had the smallest number of computer tomography (CT) scanners in hospitals relative to the number of inhabitants with 0.9 CT scanners per 100,000 inhabitants, followed by France (1.1), the Netherlands, Poland and Slovakia (all 1.4), according to a press release.
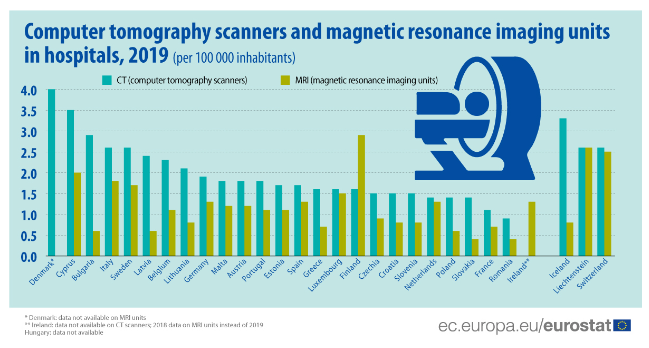
Among the EU Member States with available data, Denmark recorded the highest availability CT scanners in hospitals relative to the number of inhabitants with 4.0 CT scanners per 100 000 inhabitants, followed by Cyprus (3.5), Bulgaria (2.9), Italy and Sweden (both 2.6).
The availability of magnetic resonance imaging (MRI) units relative to the number of inhabitants was highest in Finland (with 2.9 MRI units per 100 000 inhabitants), Cyprus (2.0), Italy (1.8) and Sweden (1.7), while the lowest availability was in Slovakia and Romania (both 0.4 MRI units per 100 000 inhabitants), followed by Bulgaria, Latvia and Poland (all 0.6).
Eurostat stated that between 2014 and 2019, the availability of CT scanners relative to the number of inhabitants increased in most Member States with available data.
The highest increases were recorded in Bulgaria, Romania and Slovenia (all +0.4 scanners per 100 000 inhabitants), while the highest decreases were registered in Luxembourg and Finland (both -0.5 scanners per 100 000 inhabitants) as well as Portugal (-0.4).
The availability of CT scanners per 100 000 inhabitants did not change* in Germany and Greece.
According to the data during the same period, the most notable increase in the availability of MRI units was recorded in Finland with an increase of 0.5 units per 100 000 inhabitants, followed by Portugal (+0.4), while a slight decrease was recorded in France (-0.1 units per 100 000 inhabitants). The availability of MRI units per 100 000 inhabitants did not change* in Belgium, Greece.
* A change close to 0: between +0.05 and -0.05 per 100 000 inhabitants
- 2019 data: Denmark: data not available on MRI units; Ireland: data not available on CT scanners; 2018 data on MRI units instead of 2019; Hungary: data not available on both CT scanners and MRI units.
- 2014 data: Ireland, Hungary and Sweden: data not available on CT scanners; Denmark, Hungary, Sweden: data not available on MRI units.